After my post about my Quixotic quest to draw a portrait of the Hilbert curve, Chris Mueller pointed me to some fascinating related work he had done generating colour maps of images. Chris's method was to extract the colours from an image, sort them in natural order, and then draw the pixels out onto a Hilbert curve. The results are pretty, but have a blotchiness that demonstrates the poor clustering properties of a natural order sort nicely. If you've read my previous post (you have, haven't you?), you'll be immediately struck by the idea that we can improve this by sorting the pixels in order of the 3d Hilbert curve traversal of the RGB colour cube (you were, weren't you?). This would give us near optimal clustering, keeping similar colours together and eliminating the blotchiness. If we have a Hilbert-order sorting of the pixels, we can also project this onto other traversals of the pixels of the destination image. Using the ZigZag curve I introduced in the previous post produces a very nice result too, showing that the order in which the RGB cube is traversed is more important than the destination map.
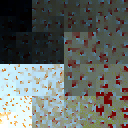
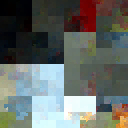
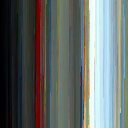
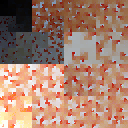
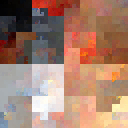
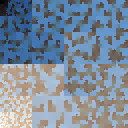
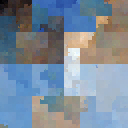
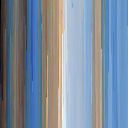
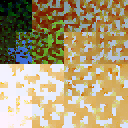
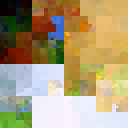
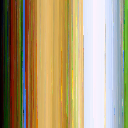
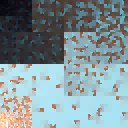
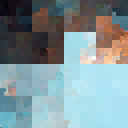
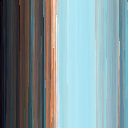
In the images below, natural is a natural-order colour sort projected onto a Hilbert curve (Chris's method), hilbert is a Hilbert-curve order colour
sort projected onto a Hilbert curve, and zigzag is a Hilbert-curve order colour sort projected onto a ZigZag curve. I've used the same images Chris used to make comparison with his other interesting visualisations easy.


Sources
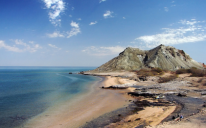
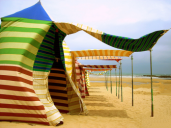
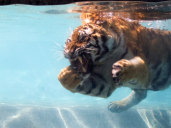
The images are from the Flickr Creative Commons collection. The tiger image is © David Blaikie. The girl image is © Bruce Tuten. The still life is © DeusXFlorida. The beach image is © Hamed Saber. The tent image is © drusbi.
The code
I've updated the scurve project (where I'm collecting algorithms and visualisation tools related to space-filling curves) to include a "colormap" tool to generate colour maps. The images above were can be generated using commands of the following form:
colormap -s 128 -c [colour traversal] -m [map] src destinationThere are a lot of other striking permutations and combinations to explore - the colour traversal and destination map can be any of the space-filling curves supported by scurve.