Over the years, I've written a number of posts on this blog on the topic of binary data visualisation. I looked at using space-filling curves to understand the structure of binary data, I've showed how entropy visualisation lets you trivially pick out compressed and encrypted sections, and I've drawn pretty pictures of malware. Unfortunately the tools I wrote (code here) all produced static images, which made making practical use a pain. You really need interactivity to be able to combine visual exploration with inspection of the actual underlying data, and to let you easily export interesting sections.
binvis.io
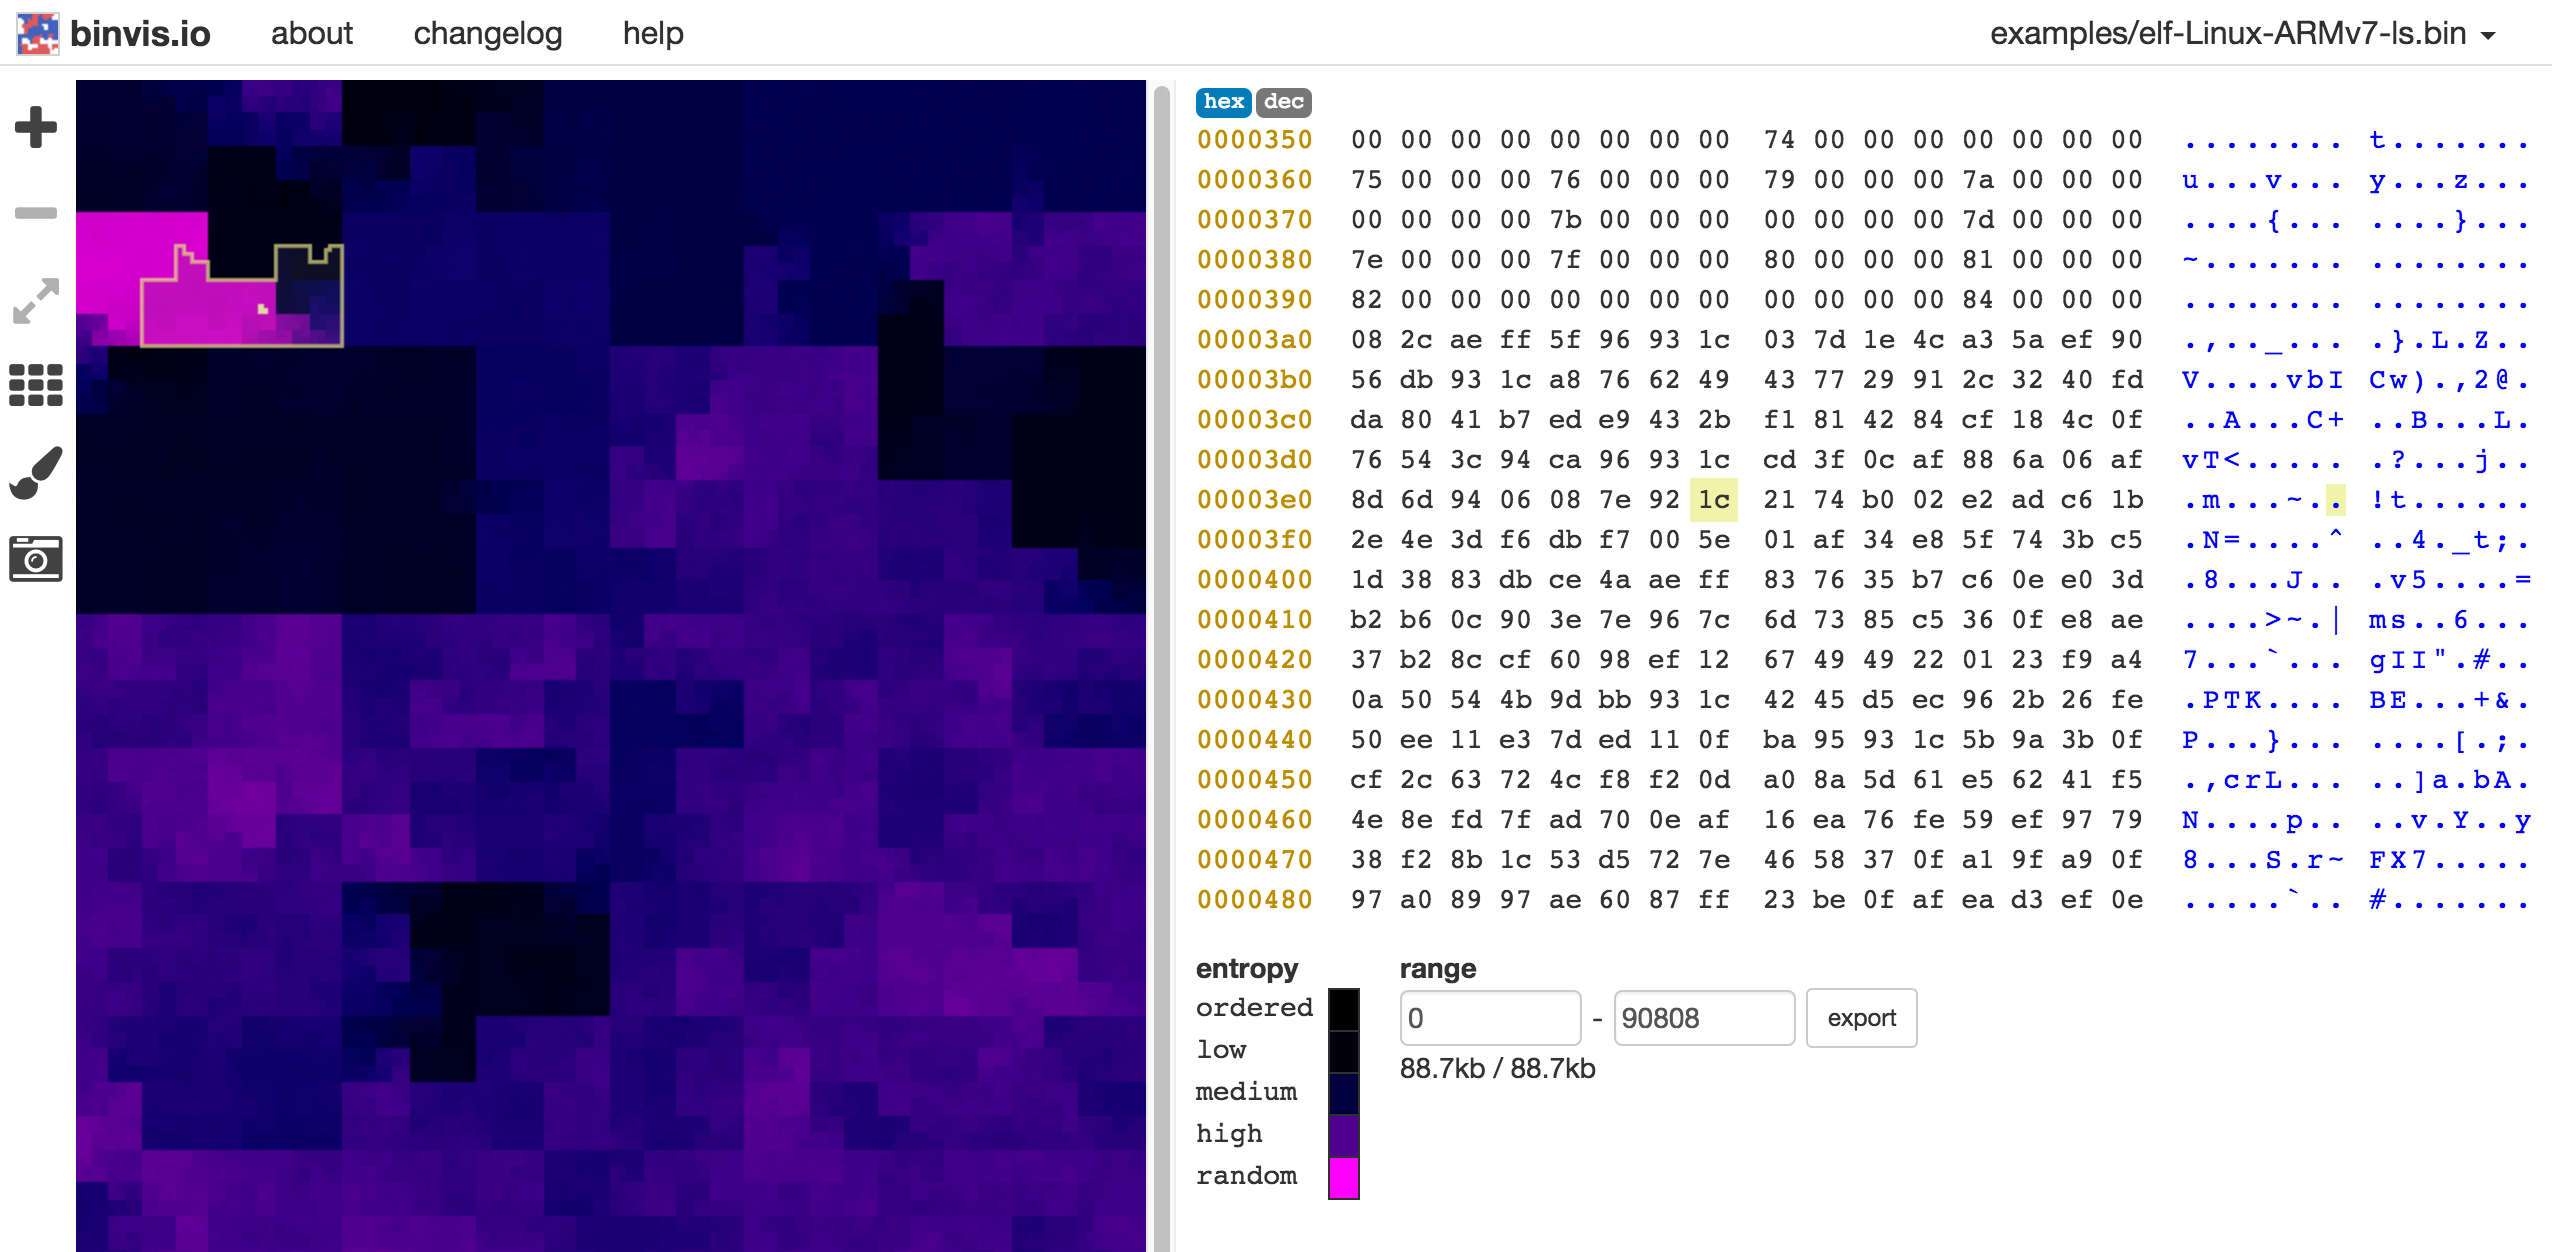
l recently started toying with the idea of using web technologies to build an interactive visualiser of this sort. One thing led to another... and today, I'm happy to announce a first draft of the idea: binvis.io
With binvis.io you can:
- Visually explore binary data
- Cluster bytes to pick out fine structural features with space-filling curves
- Use the simple scan layout to navigate and select data intuitively
- Flip between a number of useful byte color mappings, including an entropy visualiser that lets you pick out compressed or encrypted sections
- Export data segments for analysis
Next steps
Right now, Binvis is local only - that is, when you open a file, all analysis is done in your browser and nothing is sent to the server. In the longer term, I'd like to add the ability to upload, share and annotate binaries, both publicly and privately. There is probably a market of... oh, at least a dozen people out there who would have use for an imgur-like sharing system for binaries. Fame and riches surely await. Of course, there are also an immense number of other improvements to be made to almost every aspect of binvis, ranging from speed, to better colour schemes, to improvements in interaction and UX.
The todo list is long, and time is short, so I'm looking for serious collaborators. If you're interested, drop me a line!
Thanks
Binvis isn't the first interactive binary visualisation tool of this sort. A few others that spring to mind are ..cantor.dust, bininspect and binglide. I'm trying to learn from these precursors, and I'm delighted to see that they all also drew, to a greater or lesser extent, on my earlier work. Thus the eternal cycle of code rolls on.
I'd like to particularly thank Greg Conti for letting me re-use the name of his own, much earlier visualisation tool, for publishing a fascinating series of papers and talks on the topic, and for providing feedback both on this particular incarnation of the idea as well as my earlier dabblings.